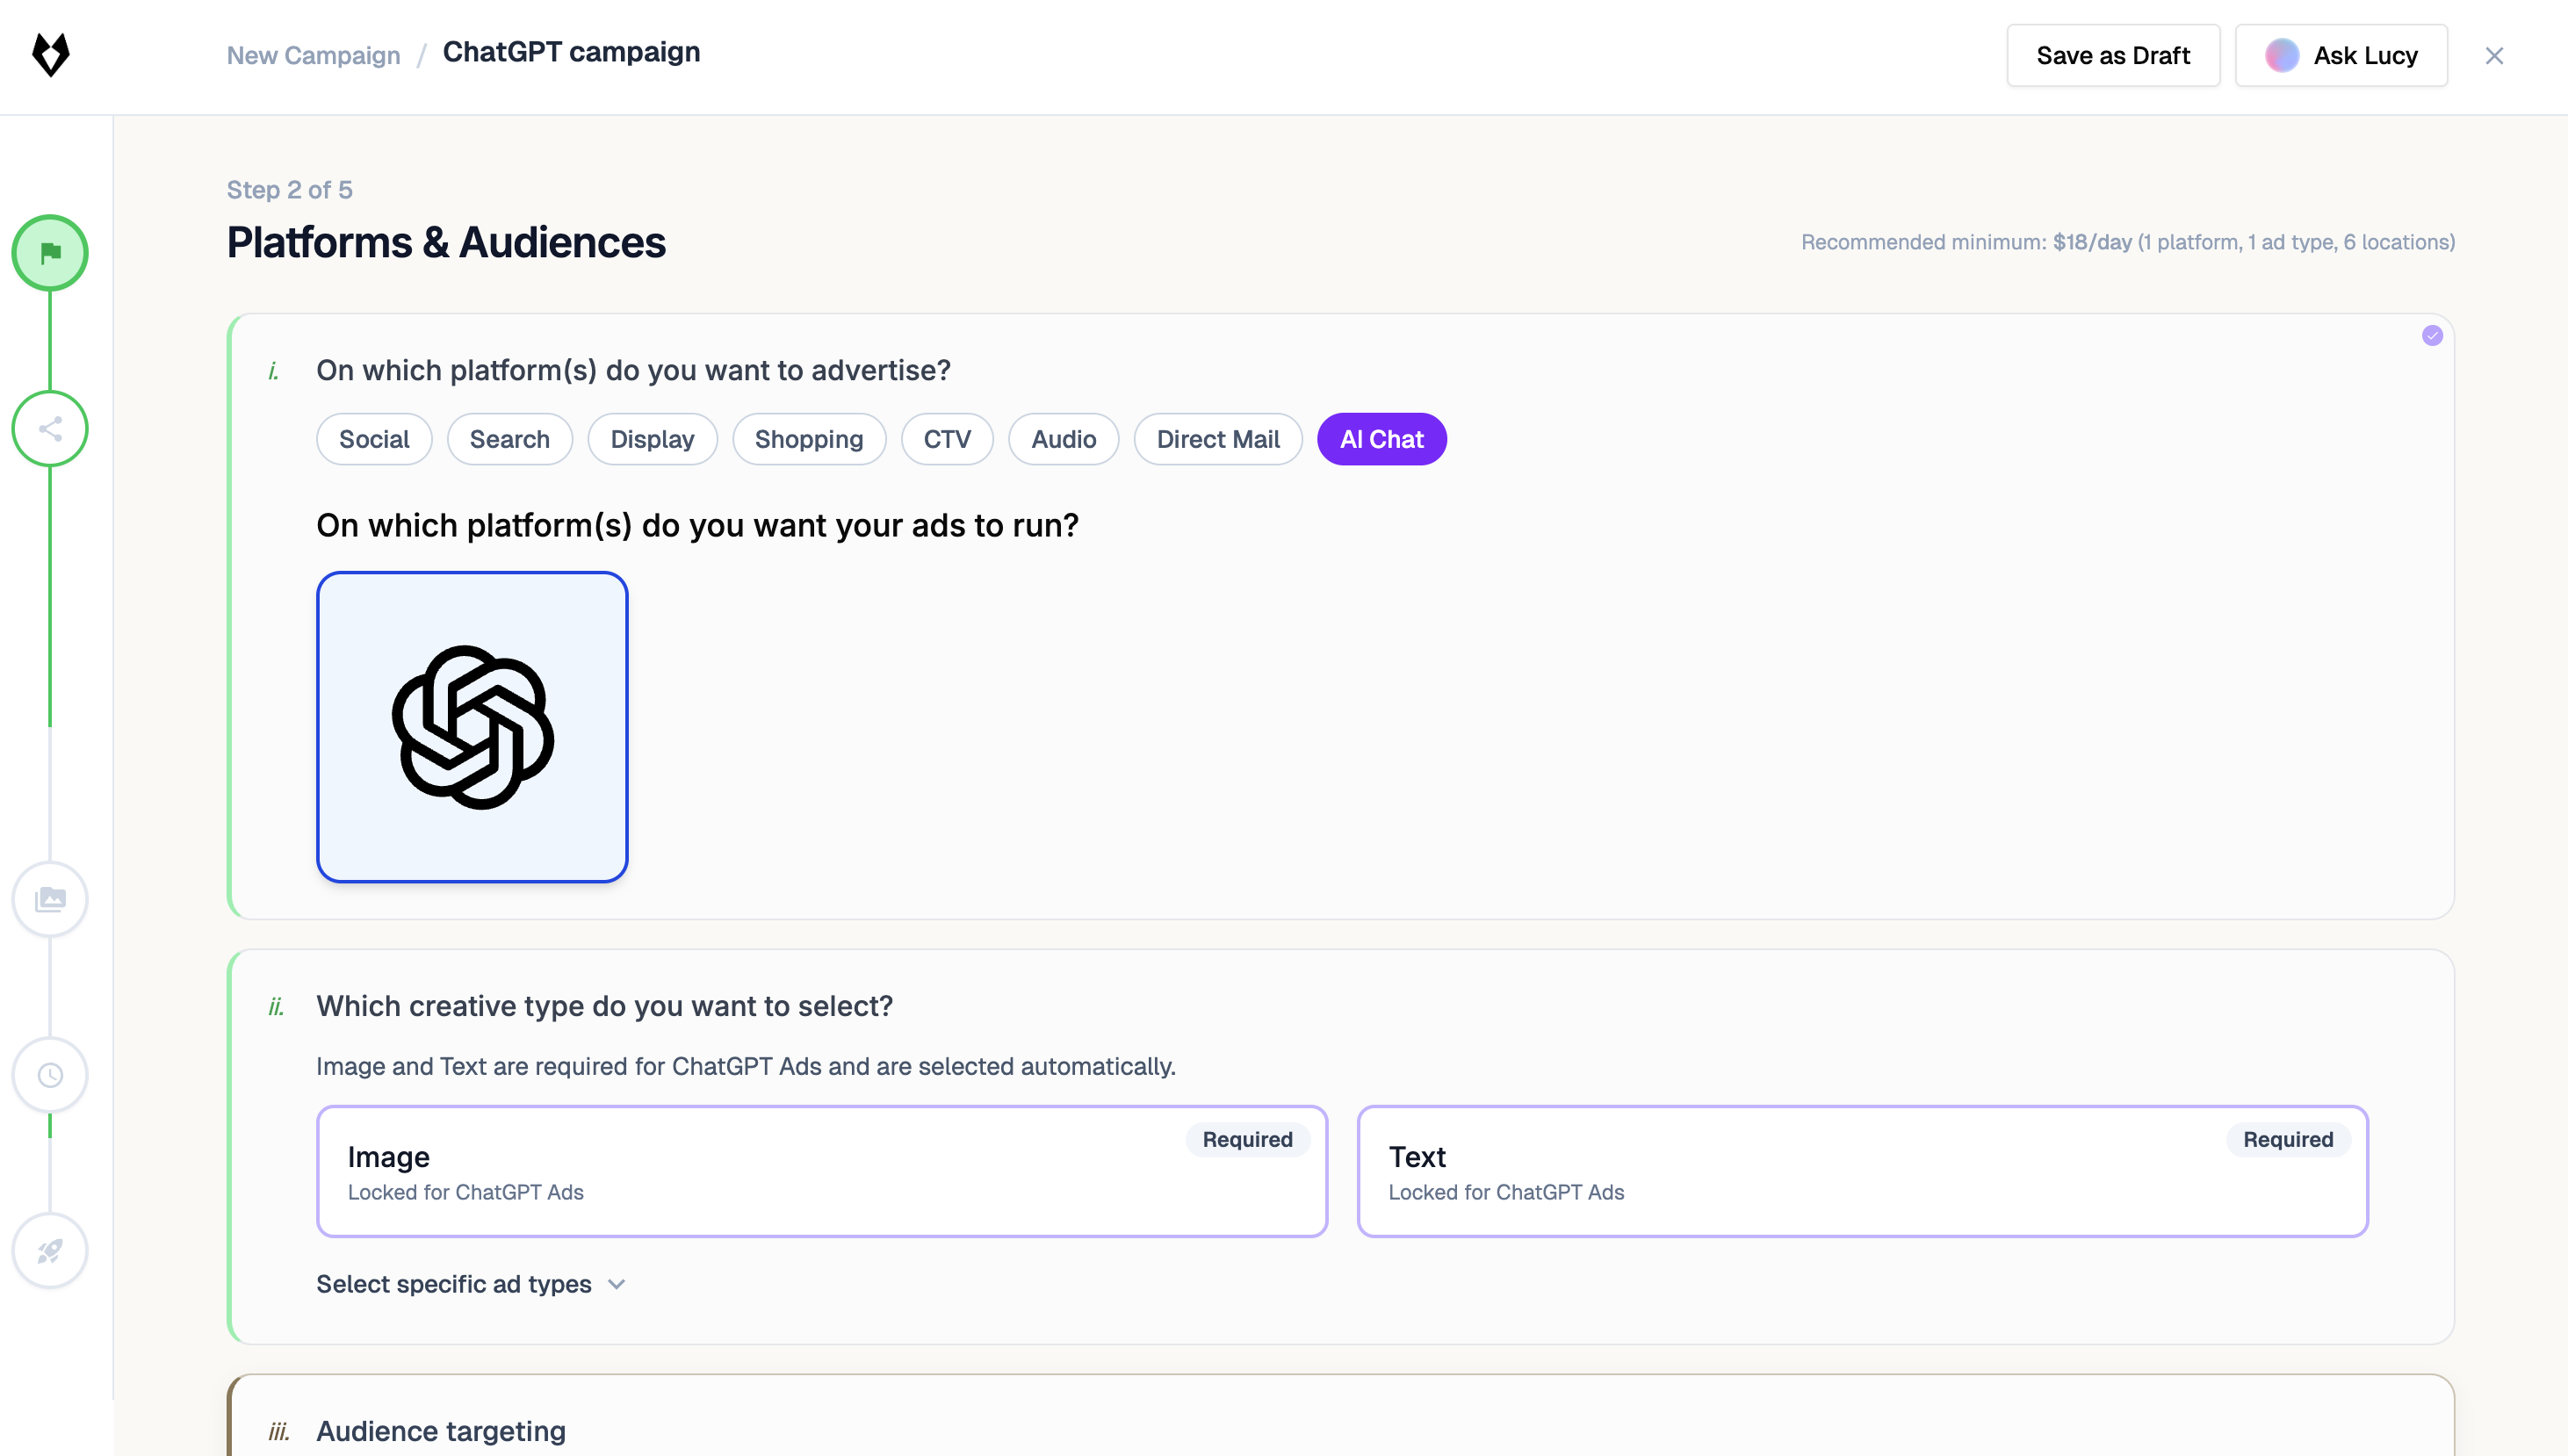
AI Chat Channel: ChatGPT Ads
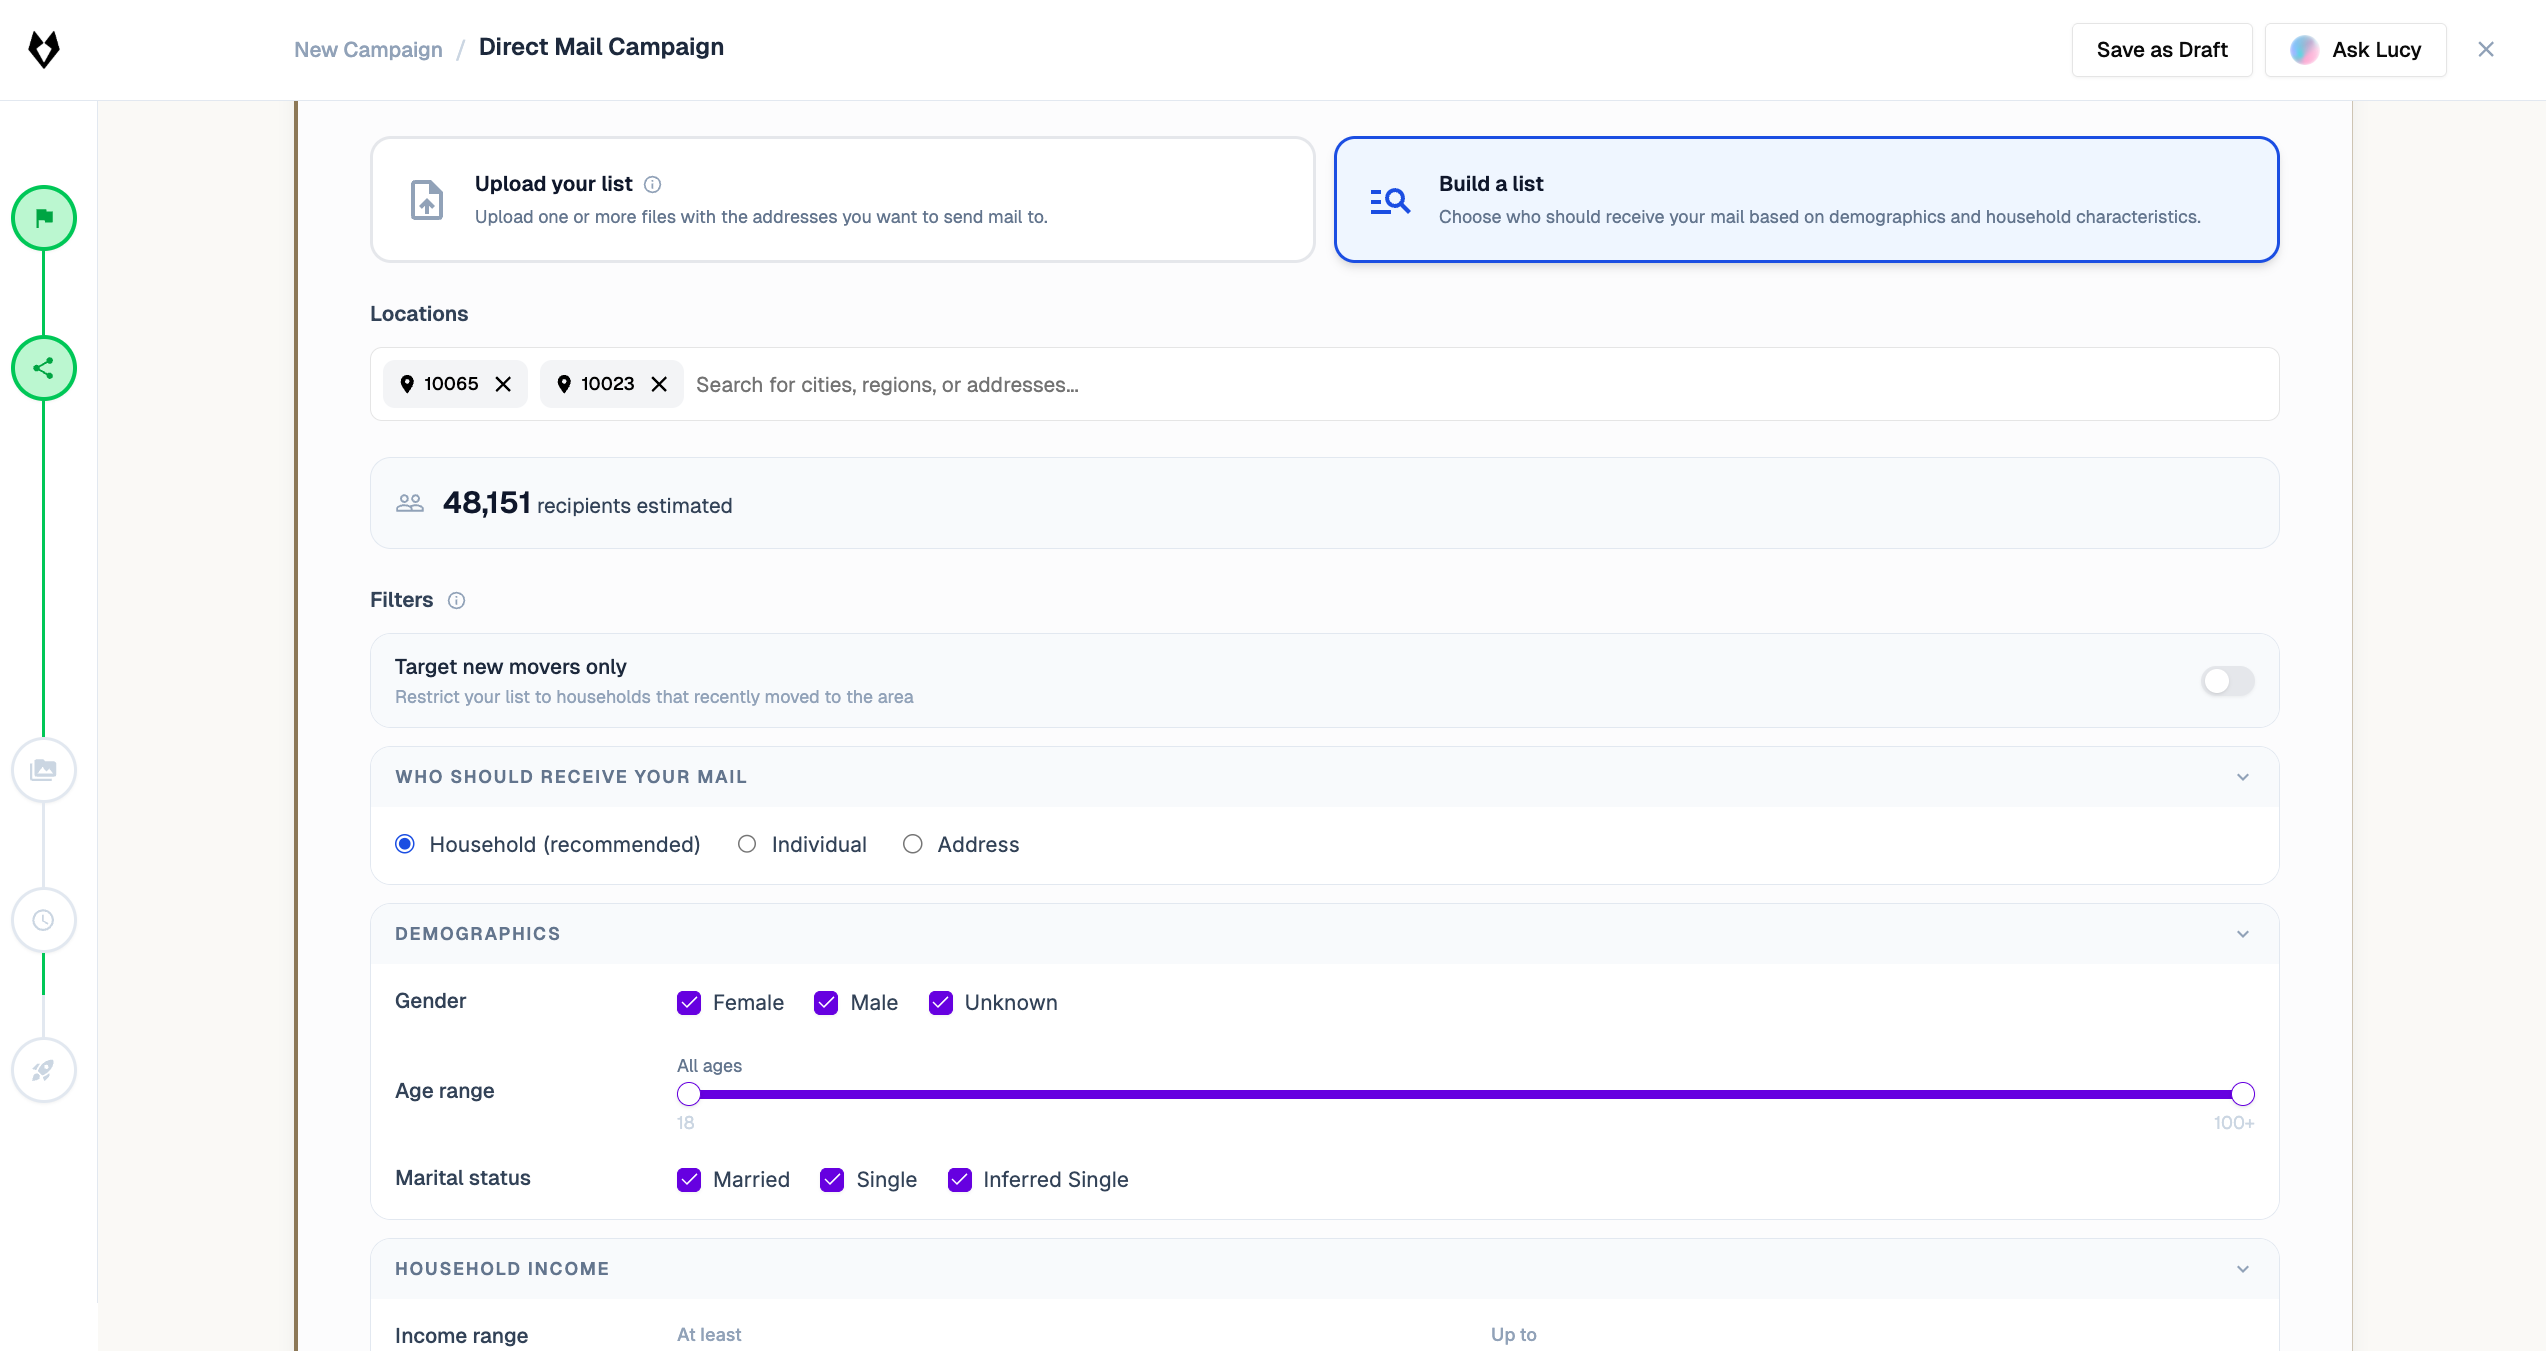
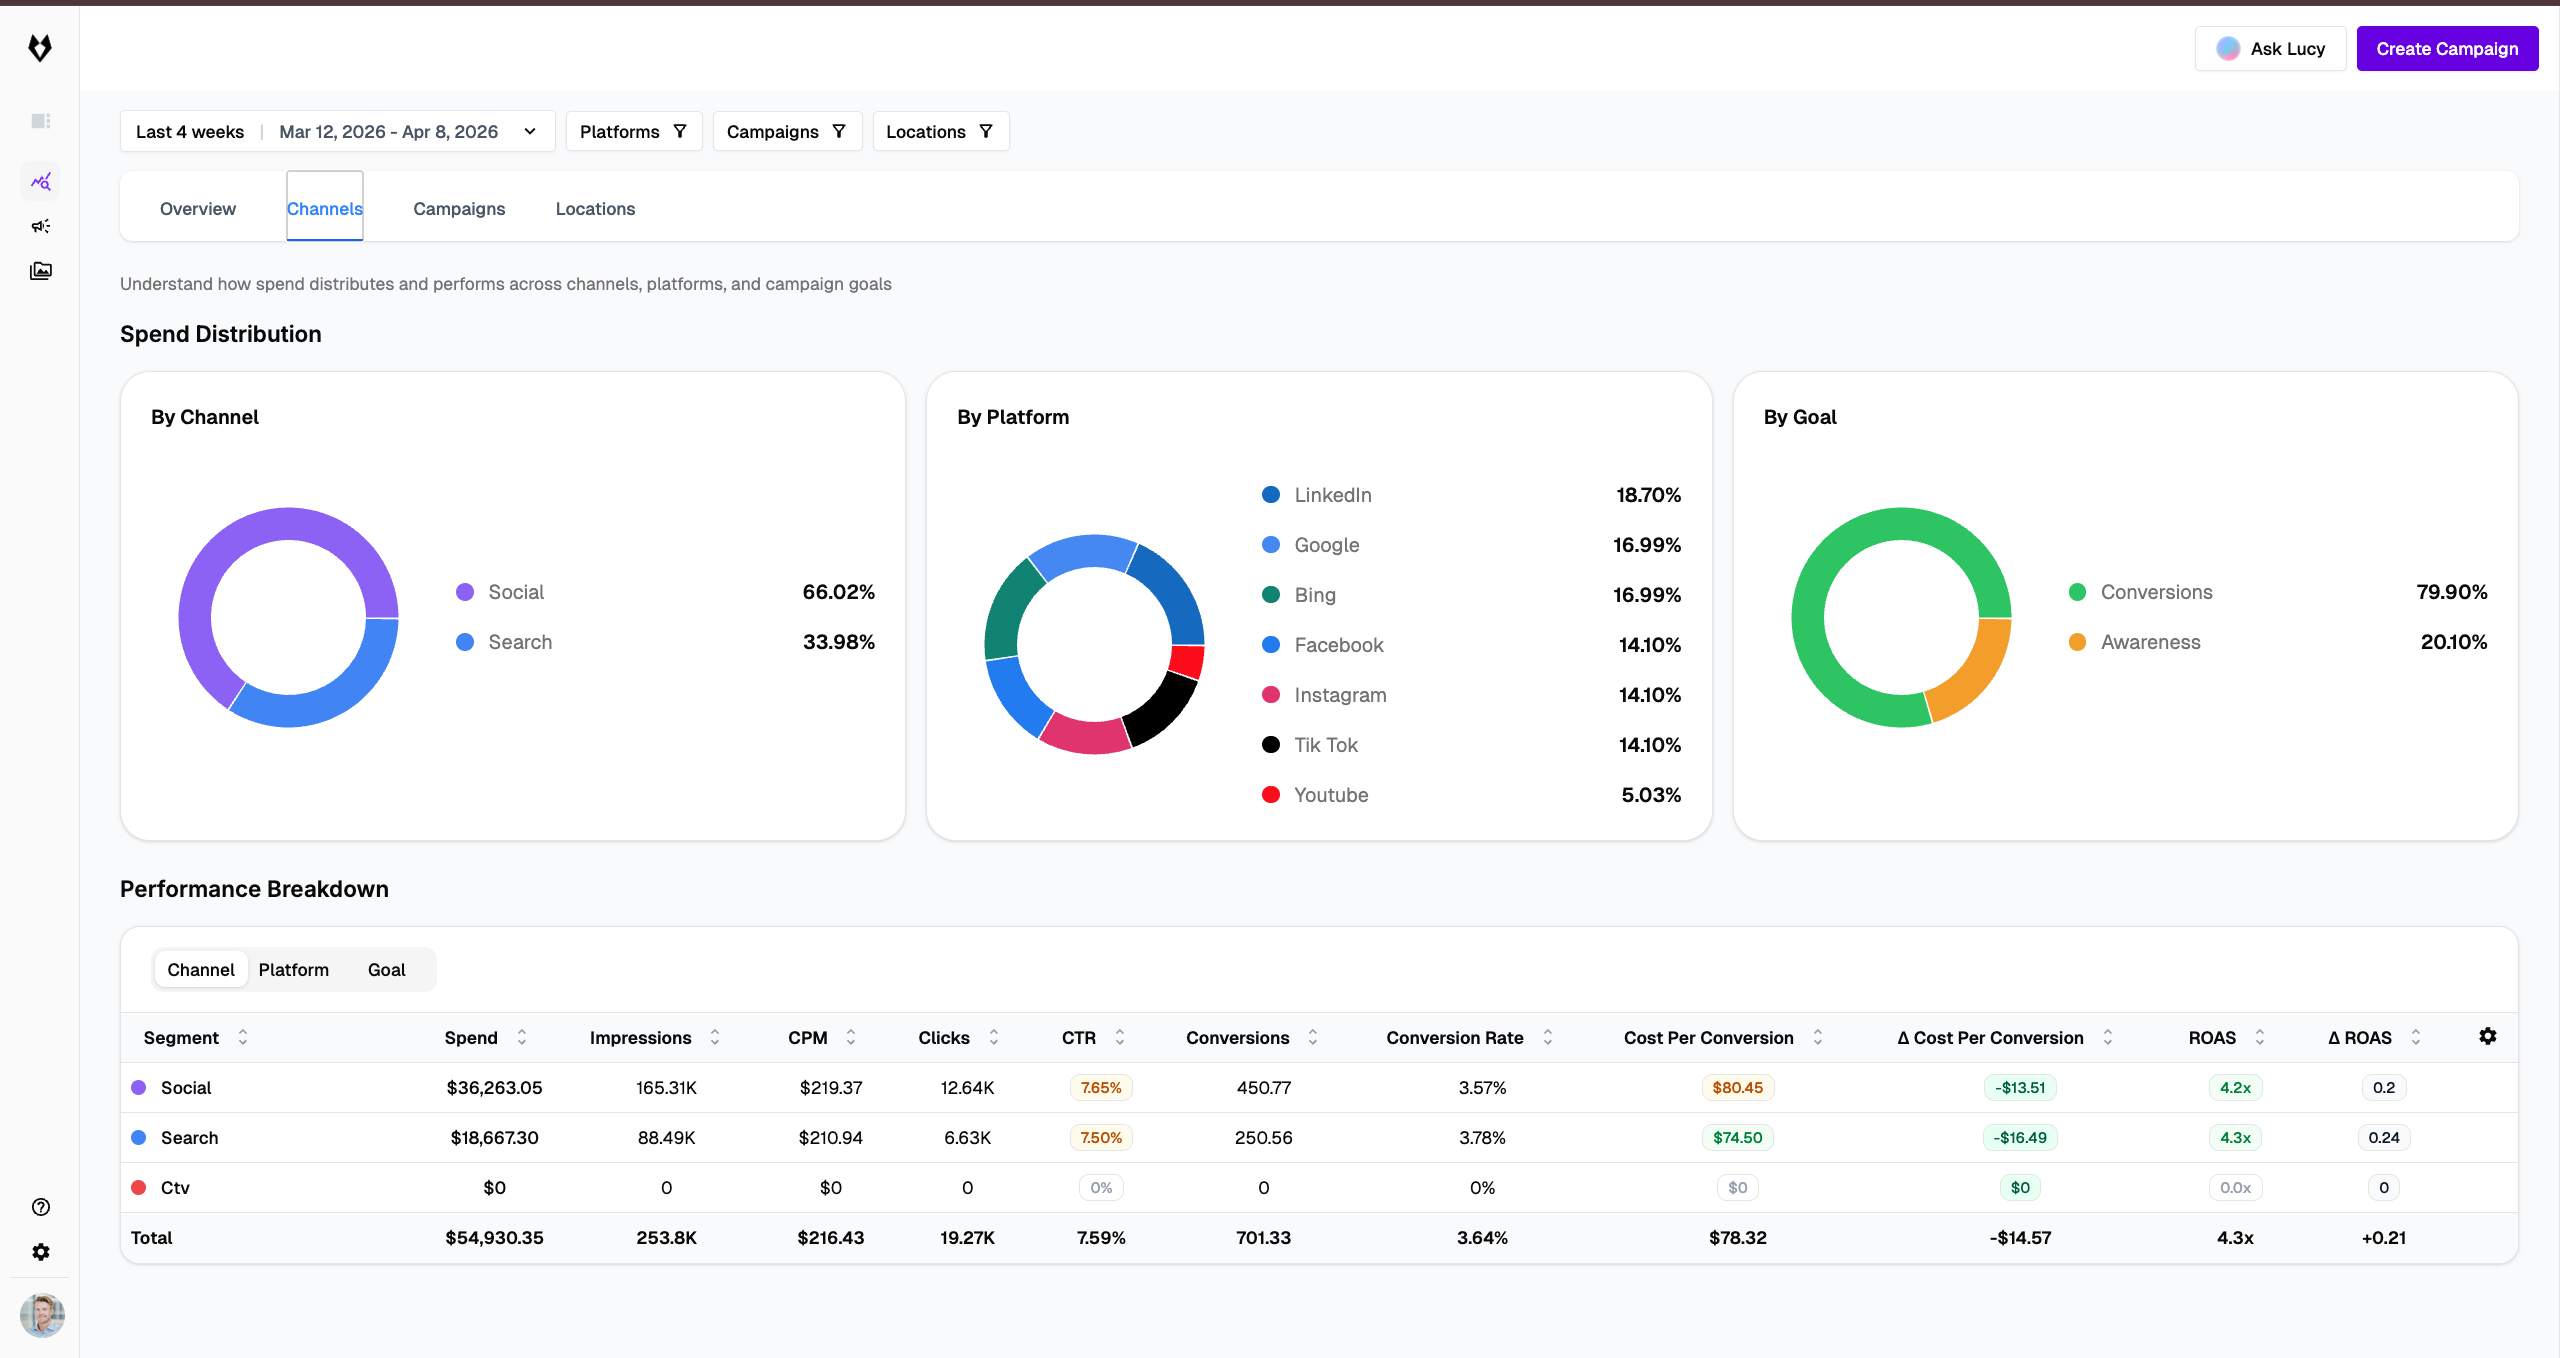
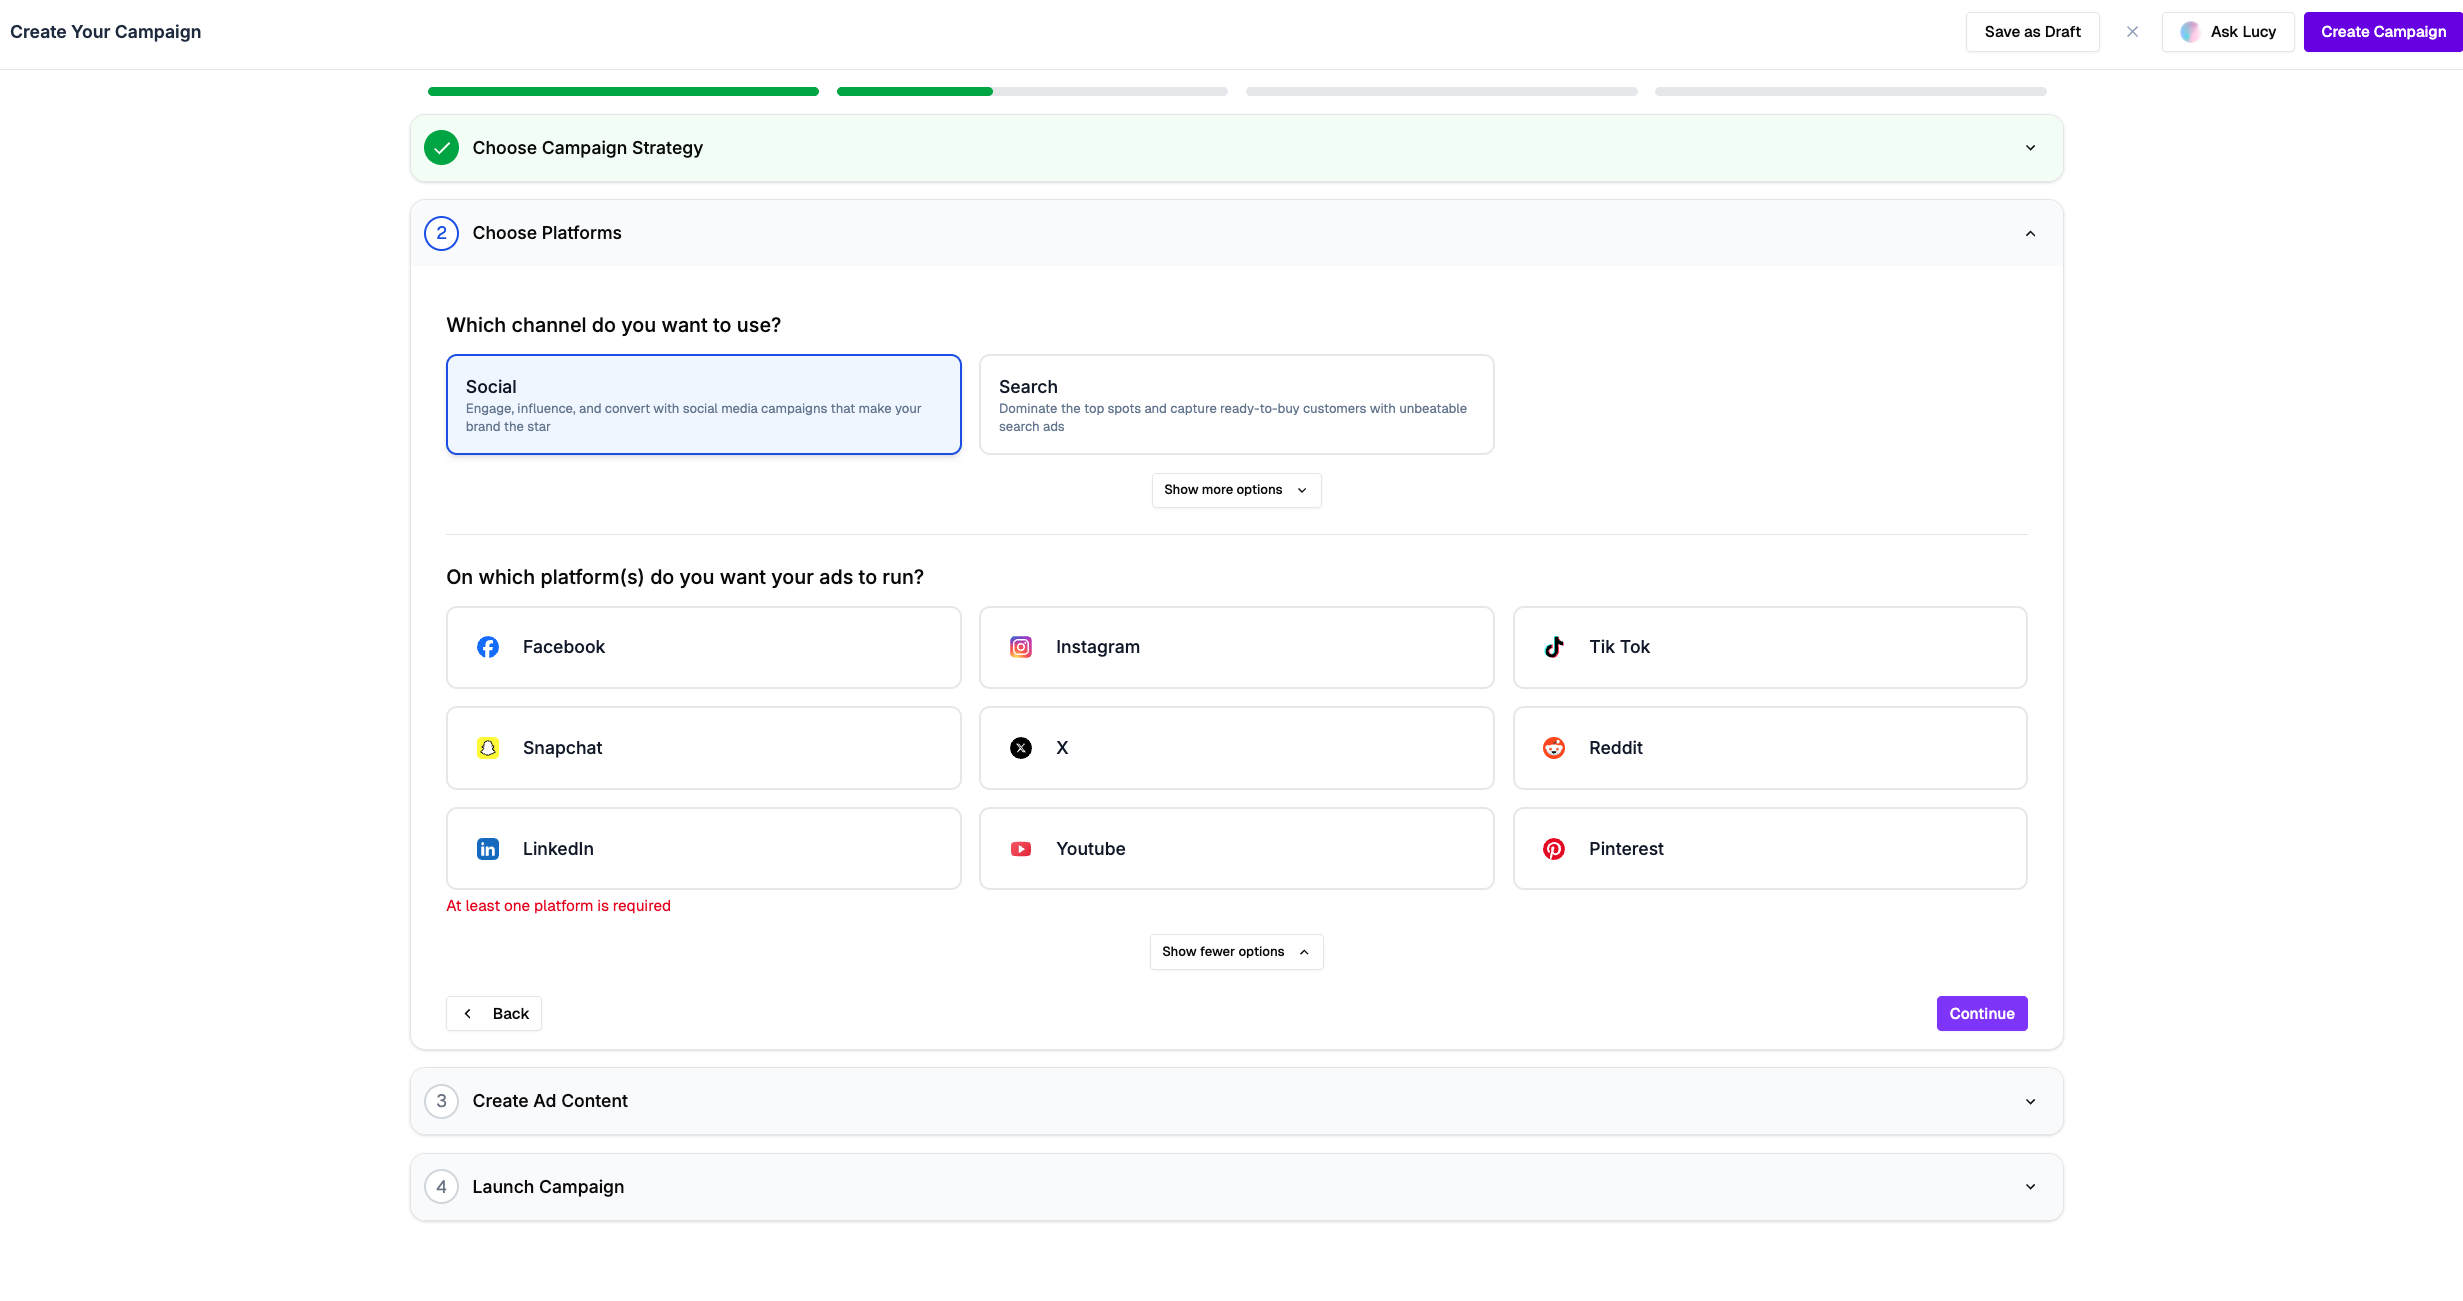
Advertising just entered a new frontier. AI Chat is now a fully integrated channel in Lofi, starting with ChatGPT Ads, letting you reach customers right where they're asking questions, comparing options, and making decisions. AI chat is a genuinely new kind of advertising surface. People don't come to ChatGPT just to search for a link; they come to explore options, weigh tradeoffs, and make decisions in a back-and-forth conversation. In those exchanges they share far richer context than a keyword ever captures, which means ads can show up in the exact moment of real intent and feel relevant and useful rather than interruptive. Ads are clearly labeled and kept separate from ChatGPT's answers, so they fit naturally into an experience built around conversation and context. With hundreds of millions of people now turning to AI assistants to discover products and services, this is the early ground floor of AI-native advertising. When you build a campaign, you'll find AI Chat sitting alongside Social, Search, Display, Shopping, CTV, Audio, and Direct Mail in the platform selector. Select it, choose ChatGPT as your platform, and Lofi handles the rest. Image and Text creatives are required for ChatGPT Ads and are selected automatically, so your ads are formatted correctly for the conversational surface from the start. Because AI Chat lives in the same campaign wizard as every other channel, you can coordinate it with the rest of your marketing in one place. Launch a ChatGPT campaign next to your Search and Social efforts, target the same locations and audiences, and measure performance side by side in the same dashboard. Getting in now gives you a first-mover advantage in one of the fastest-growing advertising surfaces. AI Chat with ChatGPT Ads is available now for all Lofi customers.